Resources · Education
What Is Standard Deviation?
Standard deviation is a number that tells you how spread out the values in a data set are from the average. A small standard deviation means the numbers are close together. A large one means they are scattered. This guide explains the term in plain language with a worked example, and shows how standard deviation connects to the mean and to variance.
7 min read

What does standard deviation mean?
Standard deviation measures how spread out a set of numbers is. It answers a simple question: are the values in this data set bunched up close together, or are they scattered all over?
If the standard deviation is small, the values are tightly packed around the average. If it is large, the values reach far from the average in both directions.
For a fast number on any list of values, the standard deviation calculator takes a comma-separated, space-separated, or line-separated list and reports the mean, the standard deviation, and the variance in one step.
Standard deviation definition in plain English
In one sentence: standard deviation is the typical distance between any value in a data set and the mean of that data set.
Imagine you measured how late your friends arrived at a dinner. You worked out the average lateness. Standard deviation tells you the typical gap between any single arrival and that average. If standard deviation is two minutes, most arrivals were within a couple of minutes of the average. If it is fifteen minutes, you have at least one very early or very late friend pulling the spread wide.
The full mathematical definition involves squaring distances and taking square roots, but the underlying idea is just “average distance from the mean.”
What standard deviation tells you
Two data sets can share the same mean and look very different once you look at standard deviation:
- Set A: 4, 5, 5, 5, 6. The mean is 5. The values barely move from 5. Standard deviation is small.
- Set B: 1, 2, 5, 8, 9. The mean is also 5. The values fan out wide. Standard deviation is large.
The mean alone cannot tell those two stories apart. Standard deviation is the second number that fills in the gap.
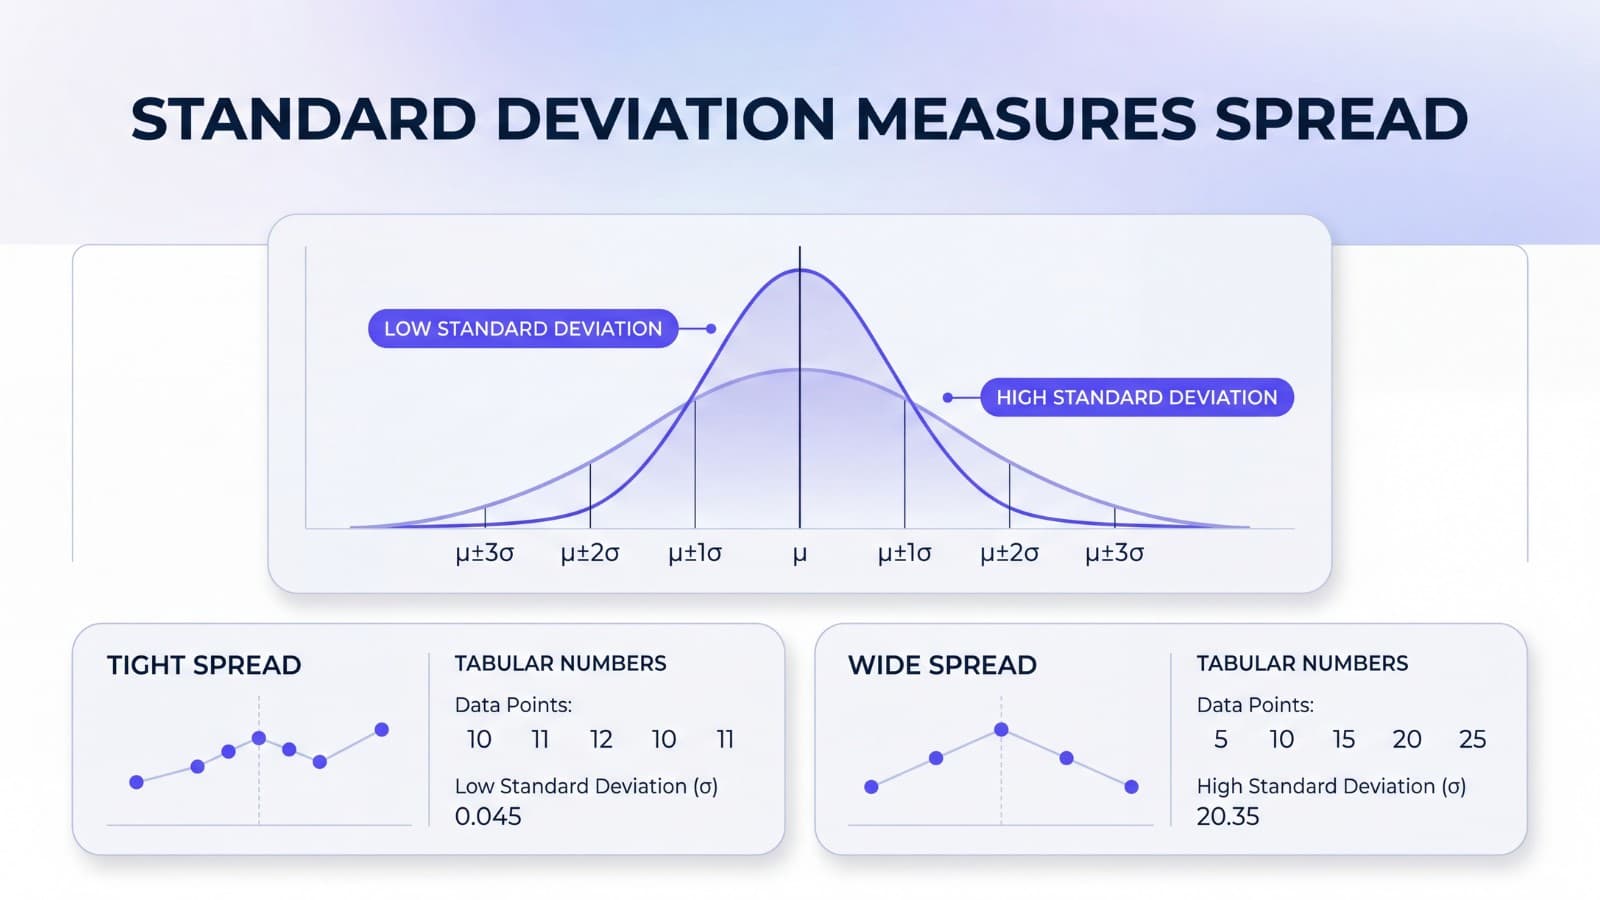
Low standard deviation vs high standard deviation
Low and high are best understood by comparison.
- Low standard deviation. Values cluster close to the mean. The data is consistent and predictable. Test scores in a class where most students landed within a few points of the average have low standard deviation.
- High standard deviation. Values fan out from the mean. The data is variable. Daily returns on a volatile stock, or weights of a mixed crowd of athletes, tend to have high standard deviation.
Whether high or low is “good” depends entirely on the situation. Low standard deviation is a positive signal for things you want to be reliable (manufacturing tolerances, test scoring, savings account growth) and a negative one for things you want variety in.
Standard deviation example with simple numbers
Take this small data set: 2, 4, 4, 4, 5, 5, 7, 9.
Step 1. Find the mean.
(2 + 4 + 4 + 4 + 5 + 5 + 7 + 9) / 8 = 40 / 8 = 5
The mean is 5.
Step 2. For each value, find the distance from the mean and square it.
- (2 − 5)² = 9
- (4 − 5)² = 1
- (4 − 5)² = 1
- (4 − 5)² = 1
- (5 − 5)² = 0
- (5 − 5)² = 0
- (7 − 5)² = 4
- (9 − 5)² = 16
Step 3. Average the squared distances. That number is the variance.
(9 + 1 + 1 + 1 + 0 + 0 + 4 + 16) / 8 = 32 / 8 = 4
Variance is 4.
Step 4. Take the square root.
√4 = 2
Standard deviation is 2. So in this data set, values land an average of 2 units from the mean of 5.
Example summary
Data: 2, 4, 4, 4, 5, 5, 7, 9
Mean = 5 · σ = 2 · variance = 4
(This example uses the population formula, dividing by the count. The sample version divides by n − 1 instead, which gives s ≈ 2.1381 for the same data. Most data analysis tools default to the sample version. For when to use which, see Sample vs Population Standard Deviation.)
How standard deviation relates to the mean
The mean is the anchor that standard deviation measures distance from. Without a mean, there is nothing to compare values to.
That is why every standard deviation calculation has a mean in the middle of it: you need the mean before you can ask “how far is each value from this average?”
One small consequence: if every value in your data set is the same number, the mean equals that number, every distance is zero, and standard deviation is zero. Zero spread is possible; negative spread is not.
How standard deviation relates to variance
Variance and standard deviation are two ways of describing the same idea: how spread out a data set is. They are connected by a simple rule:
Variance to standard deviation
standard deviation = √variance
Variance is the average of the squared distances from the mean. Standard deviation is just the square root of that number, which puts the answer back into the same units as your data. If your data is in dollars, variance is in squared dollars (which nobody can intuitively read), and standard deviation is in dollars (which everyone can).
For a calculator that reports both at the same time, see the variance calculator. It also breaks out population vs sample variants. For a full side-by-side comparison of the two measures and when to use each, see Variance vs Standard Deviation.
Why standard deviation is useful
Standard deviation shows up across statistics, finance, science, and quality control because the mean alone hides the story.
- Test scores. Two classes can share an average of 80, but if one has standard deviation 3 and the other has 18, the second classroom looks completely different.
- Investment returns. Two funds can have the same average annual return, but the one with the larger standard deviation swings harder from year to year.
- Manufacturing. A part has a target dimension, and a tight standard deviation across a production run means the line is consistent.
- Forecasting. Many error bars and prediction intervals you see on charts are built from standard deviations.
In every case, the same number (standard deviation) is doing the same job: describing how much the data wiggles around its average.
How to interpret standard deviation
A few practical rules of thumb make standard deviation easier to read:
- Compare standard deviation to the mean. A standard deviation of 2 around a mean of 100 is small. A standard deviation of 2 around a mean of 4 is large.
- For data that is roughly bell-shaped, about 68 percent of values fall within one standard deviation of the mean, and about 95 percent fall within two. This is a useful shortcut, but it only applies to data that follows a normal distribution.
- Standard deviation is sensitive to outliers because it squares distances. One unusually high or low value can pull standard deviation up sharply, even if most of the data is clustered.
- Standard deviation cannot be negative. The smallest possible value is zero, which only happens when every value in the data set is the same.
Treat the number as a description of consistency, not as a verdict. Whether a particular standard deviation is good or bad depends on what the data is meant to represent.
Standard deviation calculator vs doing it manually
Doing the math by hand is a useful exercise once. After that, a calculator is faster and less error-prone. Five steps and one square root for every data set adds up.
The calculator approach:
- Paste your numbers as commas, spaces, or one per line.
- Read the mean, both standard deviation variants (population and sample), and both variances at once.
- Move on with your day.
For more than a handful of values, the standard deviation calculator saves a lot of arithmetic. Keep the manual method in your back pocket for when you want to double-check what the calculator is doing. For the formulas in detail and a step-by-step walkthrough of the math, see Standard Deviation Formula. If your data already lives in a spreadsheet, see How to Calculate Standard Deviation in Excel. And for the symbol cheat sheet (σ, s, μ, x̄), see Standard Deviation Symbol.
Common mistakes
A few things to watch for when reading or reporting standard deviation:
- Reading standard deviation without comparing it to the mean. A standard deviation of 2 around a mean of 100 is small. A standard deviation of 2 around a mean of 4 is large. The number on its own is hard to interpret.
- Treating standard deviation as a sign of correctness. Standard deviation describes consistency, not accuracy. Precise data can be inaccurate, and accurate data can be imprecise. For comparing measurements to a fixed accepted value, see the percent error calculator.
- Ignoring outliers. Standard deviation squares distances, so a single very large or very small value can pull the result up sharply. Investigate outliers before reporting; do not silently drop them, but make sure they are not data-entry errors.
- Mixing up sample and population versions. Most data is a sample of something larger and should use n − 1 in the denominator. Population (N) is correct only when your data covers the entire group.
- Confusing variance and standard deviation. Variance is in squared units; standard deviation is the square root and shares units with the data. Reporting one when the audience expects the other leads to confusing answers.
Standard deviation and z scores
Standard deviation is also the unit a z score uses. A z score expresses how many standard deviations a single value sits from the mean of its data set, so once you have a standard deviation you can standardize any value against it. The z score calculator takes a raw score, mean, and standard deviation and returns the z score, and the Z Score Formula guide walks through the calculation and what positive, negative, and zero z scores mean.
Quick summary
- Standard deviation measures how spread out a data set is.
- Low standard deviation means values cluster near the mean.
- High standard deviation means values fan out from the mean.
- It is calculated using each value's distance from the mean.
- Standard deviation = √variance. They describe the same spread in different units.
- Standard deviation is never negative.
- The standard deviation calculator gives you the answer in seconds.
Run the numbers
Three calculators for the spread side of statistics: standard deviation, variance, and a p-value tool that works in standard deviation units once you have a z-score.
Standard Deviation Calculator
Mean, population and sample standard deviation, and both variances from a list of numbers.
Variance Calculator
Population and sample variance, mean, count, and standard deviation in one step.
P Value Calculator
Convert a z-score (in standard deviation units) to a one-tailed or two-tailed p-value.
Frequently asked questions
Standard deviation is a number that tells you how spread out the values in a data set are from the average. A small standard deviation means values are close to the mean. A large standard deviation means they are spread out further.
Standard deviation is the typical distance between any value in a data set and the mean of that data set. Think of it as the average gap between a number and the average.
It tells you how consistent or spread out a set of numbers is. Two data sets can have the same average but very different standard deviations: one steady, one all over the place.
It depends on the context. For test scores in a class, a low standard deviation means students performed similarly. For investment returns, a low standard deviation usually means more predictable performance, which many investors prefer. There is no universal good or bad; the same number means different things in different settings.
A low standard deviation means the values in your data set are clustered close to the mean. The data is consistent and predictable. If everyone in a class scored within a few points of the average, the standard deviation is low.
You need the mean to compute standard deviation. The standard deviation measures how far values typically sit from that mean. Without a mean to compare to, standard deviation has no anchor.
No, but they are closely related. Variance is the average of the squared distances from the mean. Standard deviation is the square root of variance. Variance is in squared units, while standard deviation is in the same units as your data, which is why standard deviation is usually easier to interpret.
Yes, for any data set with more than a few values. The math is straightforward but easy to slip on by hand. A calculator handles the parsing, the mean, both standard deviation variants, and both variances at once.