Resources · Education
Standard Deviation Formula
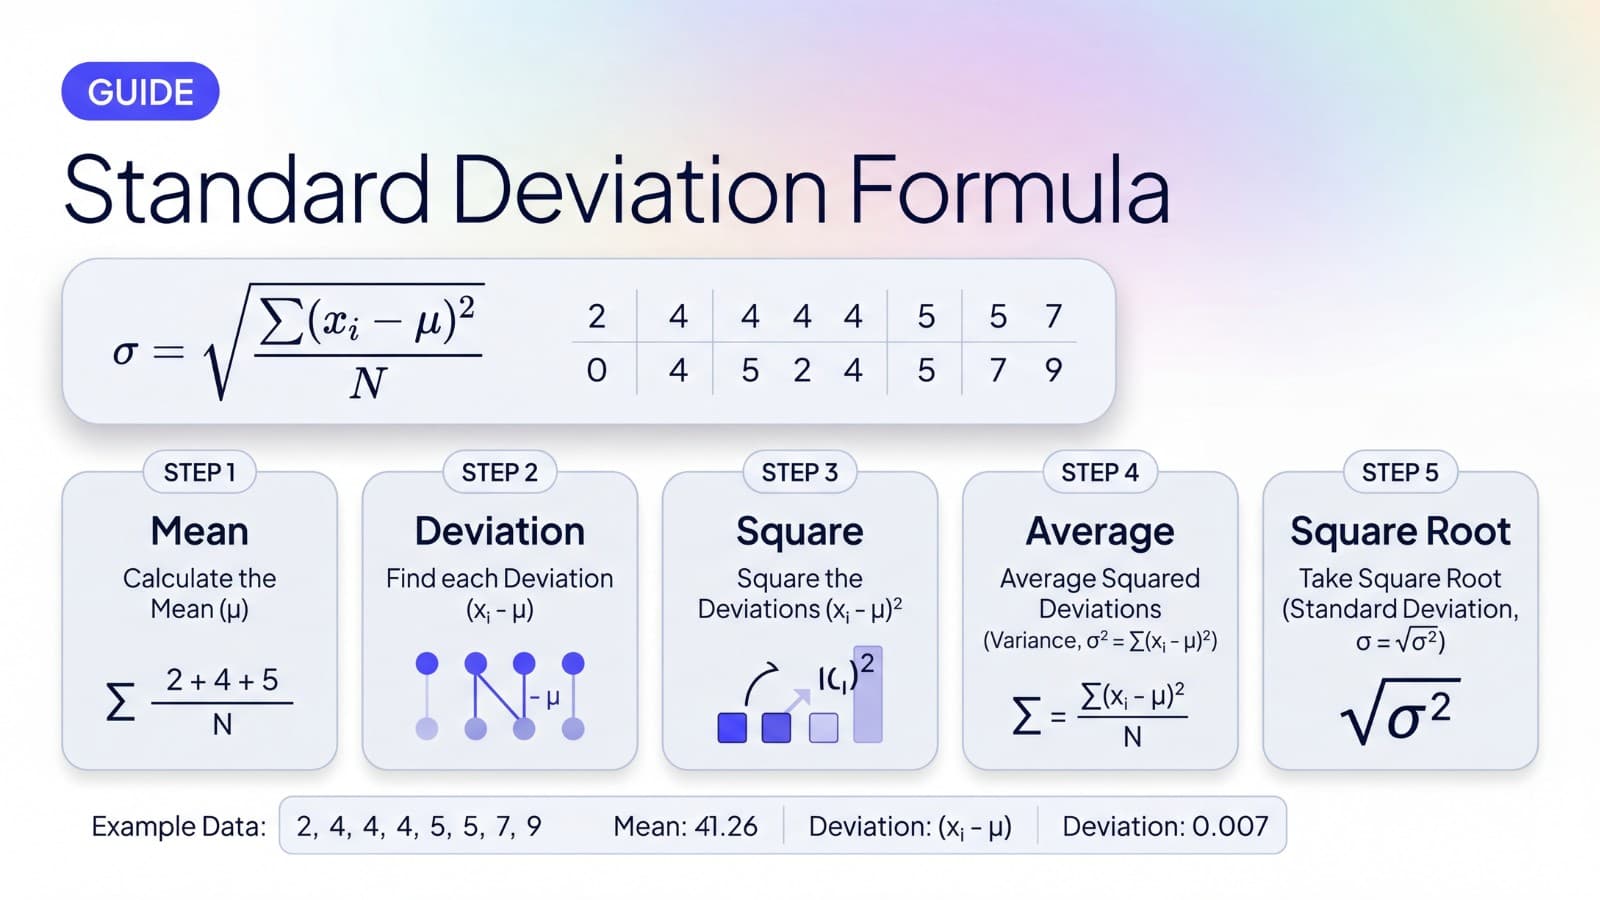
The standard deviation formula tells you how spread out a set of numbers is around the mean. Two versions exist: one for a population (when your numbers are everyone you care about) and one for a sample (when your numbers are drawn from a larger group). This guide walks through both versions, explains every symbol, and shows the full calculation on a small example. For a fast computed answer on any list of numbers, the standard deviation calculator runs both formulas at once.
7 min read

What is the standard deviation formula?
The standard deviation formula is a recipe for converting a list of numbers into a single value that describes how spread out they are around the mean. Whichever version you use, the formula does the same thing in steps: find the mean, measure how far each value sits from the mean, square those distances, average them, and take the square root.
The result lands in the same units as your data, which is why standard deviation is easy to interpret. The intermediate value (the average of squared distances) is called the variance, and it is the bridge between the raw data and the final standard deviation.
For a longer plain-language explanation of what standard deviation means and how to interpret it, see What Is Standard Deviation?.
Population standard deviation formula
When your data set is the entire group you care about, use the population formula:
Population standard deviation
σ = √(Σ(xᵢ − μ)² / N)
It looks intimidating, but it just spells out the recipe: take each value, subtract the population mean, square the difference, sum those squares, divide by the count, and take the square root.
Sample standard deviation formula
When your data is a sample drawn from a larger population, use the sample formula:
Sample standard deviation
s = √(Σ(xᵢ − x̄)² / (n − 1))
It is identical to the population formula except for two things. The mean is written as x̄ (x-bar) instead of μ, and you divide by n − 1 instead of n. That n − 1 trick is called Bessel's correction.
Sample vs population standard deviation
The two formulas exist because they are doing slightly different jobs:
- Population standard deviation describes the spread of a complete data set. If you measured every member of the group you care about, this is the right formula.
- Sample standard deviation estimates the spread of a population from a sample of it. Because a sample tends to underestimate the true population spread, dividing by n − 1 instead of n nudges the estimate up to compensate.
Most statistics tools default to sample standard deviation. If you are not sure which one to use, sample is usually the safer choice. The standard deviation calculator reports both side by side so you can pick the one that matches your context. For a fuller comparison with examples and decision rules for picking between them, see Sample vs Population Standard Deviation.
What each symbol means
A short reference for every symbol in both formulas:
- σ (sigma). Population standard deviation. The capital Greek letter for “s.”
- s. Sample standard deviation.
- x. An individual value in your data set. The formulas apply the same step to each x in turn.
- μ (mu). Population mean.
- x̄ (x-bar). Sample mean.
- N. Total count in the population.
- n. Total count in the sample.
- n − 1. Sample size minus one. This is Bessel's correction, the only real difference between the population and sample formulas.
- Σ (capital sigma). Sum, applied across all the values.
Once the symbols are familiar, the formulas read like a recipe rather than a wall of math. For a fuller reference covering every symbol with short explanations of what each one represents, see Standard Deviation Symbol.
Step by step standard deviation example
We will compute standard deviation for this small data set:
2, 4, 4, 4, 5, 5, 7, 9
The next five sections walk through the calculation one step at a time. We will compute the population standard deviation first because the math is the cleanest, then show how the sample version differs at the end.
Step 1: Find the mean
Sum every value and divide by the count.
(2 + 4 + 4 + 4 + 5 + 5 + 7 + 9) / 8 = 40 / 8 = 5
The mean is 5.
Step 2: Find each distance from the mean
For every value in the data set, subtract the mean. These differences are called the deviations.
- 2 − 5 = −3
- 4 − 5 = −1
- 4 − 5 = −1
- 4 − 5 = −1
- 5 − 5 = 0
- 5 − 5 = 0
- 7 − 5 = 2
- 9 − 5 = 4
Some deviations are negative (values below the mean) and some are positive (values above the mean). That is expected.
Step 3: Square the differences
Square each deviation. Squaring does two things at once: it removes the sign of each number (squares are always non-negative), and it gives more weight to values that are far from the mean.
- (−3)² = 9
- (−1)² = 1
- (−1)² = 1
- (−1)² = 1
- (0)² = 0
- (0)² = 0
- (2)² = 4
- (4)² = 16
Sum the squared deviations:
9 + 1 + 1 + 1 + 0 + 0 + 4 + 16 = 32
Step 4: Find the variance
Variance is the average of the squared deviations. This is where the population and sample formulas diverge:
- Population variance: 32 / 8 = 4
- Sample variance: 32 / (8 − 1) = 32 / 7 ≈ 4.5714
Variance is in squared units, which is why it is rarely interpreted on its own. The square root in the next step brings the answer back into the same units as your data.
For a calculator that reports both variance and standard deviation in one step, see the variance calculator. For a side-by-side look at how the two measures relate and when to use each, see Variance vs Standard Deviation.
Step 5: Take the square root
Take the square root of the variance.
- Population standard deviation: √4 = 2
- Sample standard deviation: √(32 / 7) ≈ 2.1381
For this data set, values land an average of 2 units (population) or about 2.1381 units (sample) from the mean of 5.
Example summary
Data: 2, 4, 4, 4, 5, 5, 7, 9 · mean = 5
σ = 2 · s ≈ 2.1381
When to use a standard deviation calculator
Doing the math by hand once is a great way to understand the formula. After that, a calculator is faster and less error-prone, especially for longer data sets. Five steps and one square root for every list adds up.
The standard deviation calculator handles parsing (commas, spaces, or one number per line) and reports the mean, both standard deviation variants, and both variances at the same time. For more than a handful of numbers, it saves a real amount of arithmetic.
If your data already lives in a spreadsheet, see How to Calculate Standard Deviation in Excel for the STDEV.S and STDEV.P approach.
Common mistakes
A few traps that catch people running the formula by hand:
- Skipping the square step. Without squaring, the deviations from the mean cancel out to zero. Squaring is what keeps positive and negative gaps from erasing each other.
- Dividing by N when you should divide by n − 1. For sample data (almost always), use n − 1. Dividing by N gives a slightly biased underestimate of the population spread.
- Forgetting the square root at the end. Without the square root, you have variance, not standard deviation. Variance is in squared units, which is why the square root brings the answer back to the original scale.
- Reporting too many decimal places. The formula is precise; the data usually is not. Two or three significant figures is enough for most contexts.
- Confusing s with σ in the same answer. Pick one, label it clearly. The standard deviation calculator shows both side by side so you can avoid the mismatch.
Quick summary
- Population: σ = √(Σ(x − μ)² / N)
- Sample: s = √(Σ(x − x̄)² / (n − 1))
- The only practical difference is the denominator: divide by N for population, by n − 1 for sample.
- Five-step recipe: mean, distances, squares, average (variance), square root.
- Variance and standard deviation describe the same spread in different units; standard deviation is the square root of variance.
- For a fast number, use the standard deviation calculator.
- For the meaning side, see What Is Standard Deviation?.
Run the numbers
Three calculators that work directly with the formulas in this guide.
Standard Deviation Calculator
Mean, population and sample standard deviation, and both variances from a list of numbers.
Variance Calculator
Population and sample variance, mean, count, and standard deviation in one step.
P Value Calculator
Convert a z-score (in standard deviation units) to a one-tailed or two-tailed p-value.
Frequently asked questions
Two versions exist. Population: σ = √(Σ(x − μ)² / N). Sample: s = √(Σ(x − x̄)² / (n − 1)). Both follow the same five-step recipe: find the mean, find each value's distance from the mean, square those distances, average them, then take the square root.
s = √(Σ(x − x̄)² / (n − 1)). Use this when your data is a sample drawn from a larger group. The n − 1 in the denominator is called Bessel's correction; it nudges the estimate up to compensate for the fact that a sample tends to underestimate the true population spread.
σ = √(Σ(x − μ)² / N). Use this when your data set is the entire group you care about. Divide by N because no Bessel-style correction is needed.
The denominator. Population divides the sum of squared deviations by N (the total count). Sample divides by n − 1 (one less than the count). Sample standard deviation is slightly larger and is the right choice when your numbers are a sample from a bigger population.
Two reasons. First, squaring removes the sign of each deviation; without squaring, positive and negative differences would cancel and the average would always be zero. Second, squaring gives more weight to values that are far from the mean, which makes standard deviation more sensitive to outliers.
Because squaring earlier in the calculation puts the units in squared form (squared dollars, squared inches, squared test points). The square root at the end brings the answer back into the same units as your data, which makes the result readable.
No, but they are closely connected. Variance is the average of the squared deviations from the mean. Standard deviation is the square root of variance. They describe the same spread; standard deviation is just easier to read because it shares units with the data.
Calculate by hand once to understand the formula. After that, a calculator is faster and less error-prone, especially for data sets with more than a few values. The standard deviation calculator handles parsing and reports both sample and population variants at the same time.